I’m sure we’ve all been following the emerging story of the 2019-nCoV outbreak closely, with the third cases reported in the UK yesterday (pleased to see this is where you’d expect the UK to be based on Marc’s post earlier)! There’s been a small explosion of publications in the peer reviewed literature. I’ve chosen one slightly randomly to discuss today: a short modelling study providing some insight on the likely volume of unreported cases (very much the ice berg and not the tip!) and some sense of where this outbreak will end (it depends on how we respond, globally).
The authors used a basic reporductive number of 2.3 in their model (R0), which seems about right. The model then determined the effective reproductive number (Re) following the implementation of control measures in China (the lockdown of Wuhan and its surrounding area).
The authors have produced an interactive tool so that you can play with the various parameters and predict several different futures of the 2019-nCoV outbreak (some bleaker than others).
Figure: Outputs of the model with reported vs. modeled cases
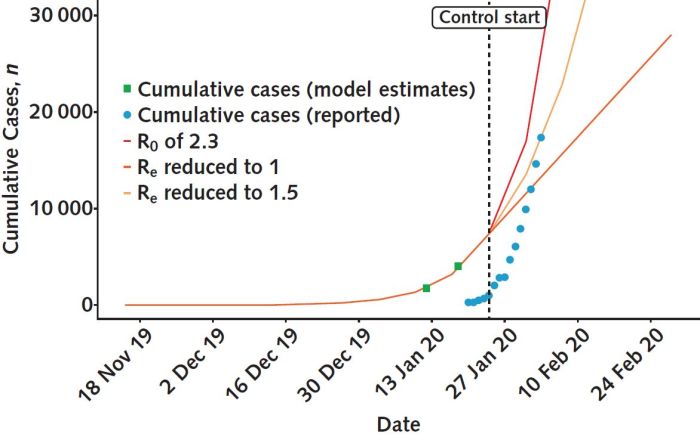
There’s an interesting story around the % of reported vs. modeled cases. According to the model, this began at around 2% at the start of the outbreak, but was approaching 60% by the end of Jan. This trend provides some evidence that public health authorities are “catching up” with the outbreak in China. But these estimates depend, of course, on the accuracy of the predictions around Re (and R0)! The model does help us in understanding the plausible limits of Re based on how many cases have actually been reported (Re cannot be <1)!
Oh, and finally, I’ve heard there’s going to be a name for this virus sometime soon. I suspect it will be [something]ARS to align it with SARS and MERS (you heard it here first…!).
Discover more from Reflections on Infection Prevention and Control
Subscribe to get the latest posts sent to your email.
