
A team of authors surveyed NHS acute hospitals in England to determine the approach to CPE detection, including laboratory methods. The findings provide an opportunity to compare the approach to CPE detection and prevalence nationally, identifying higher CPE prevalence in the North-West, North-East and the South-East (the region that includes London) of England. The findings also suggest that more screening for CPE would detect more carriers – and perhaps help to prevent a silent epidemic of CPE in some regions.
The study team sent two surveys to all acute NHS hospitals in England asking a series of questions about laboratory methods to detect CPE, and CPE screening approach and prevalence.
The rate of screening and CPE positivity was calculated for the 30 Trusts who supplied the necessary data to make these calculations. Nationally, 60 samples were screened per 10,000 patient bed days, with 0.33/10,000 of these testing positive for CPE, which equates to a positivity rate of 0.85%. However, the rate of both screening and positivity varied by region – in fact, there was a pretty strong correlation between the rate of screening and the rate of positivity; r2 = 0.6 (see Figure and Table below). This suggests that part of the reason for the variation in the apparent prevalence of CPE is that some NHS Trusts are looking harder for CPE!
Figure: Correlation between CPE screening and positivity rate, by UK region.
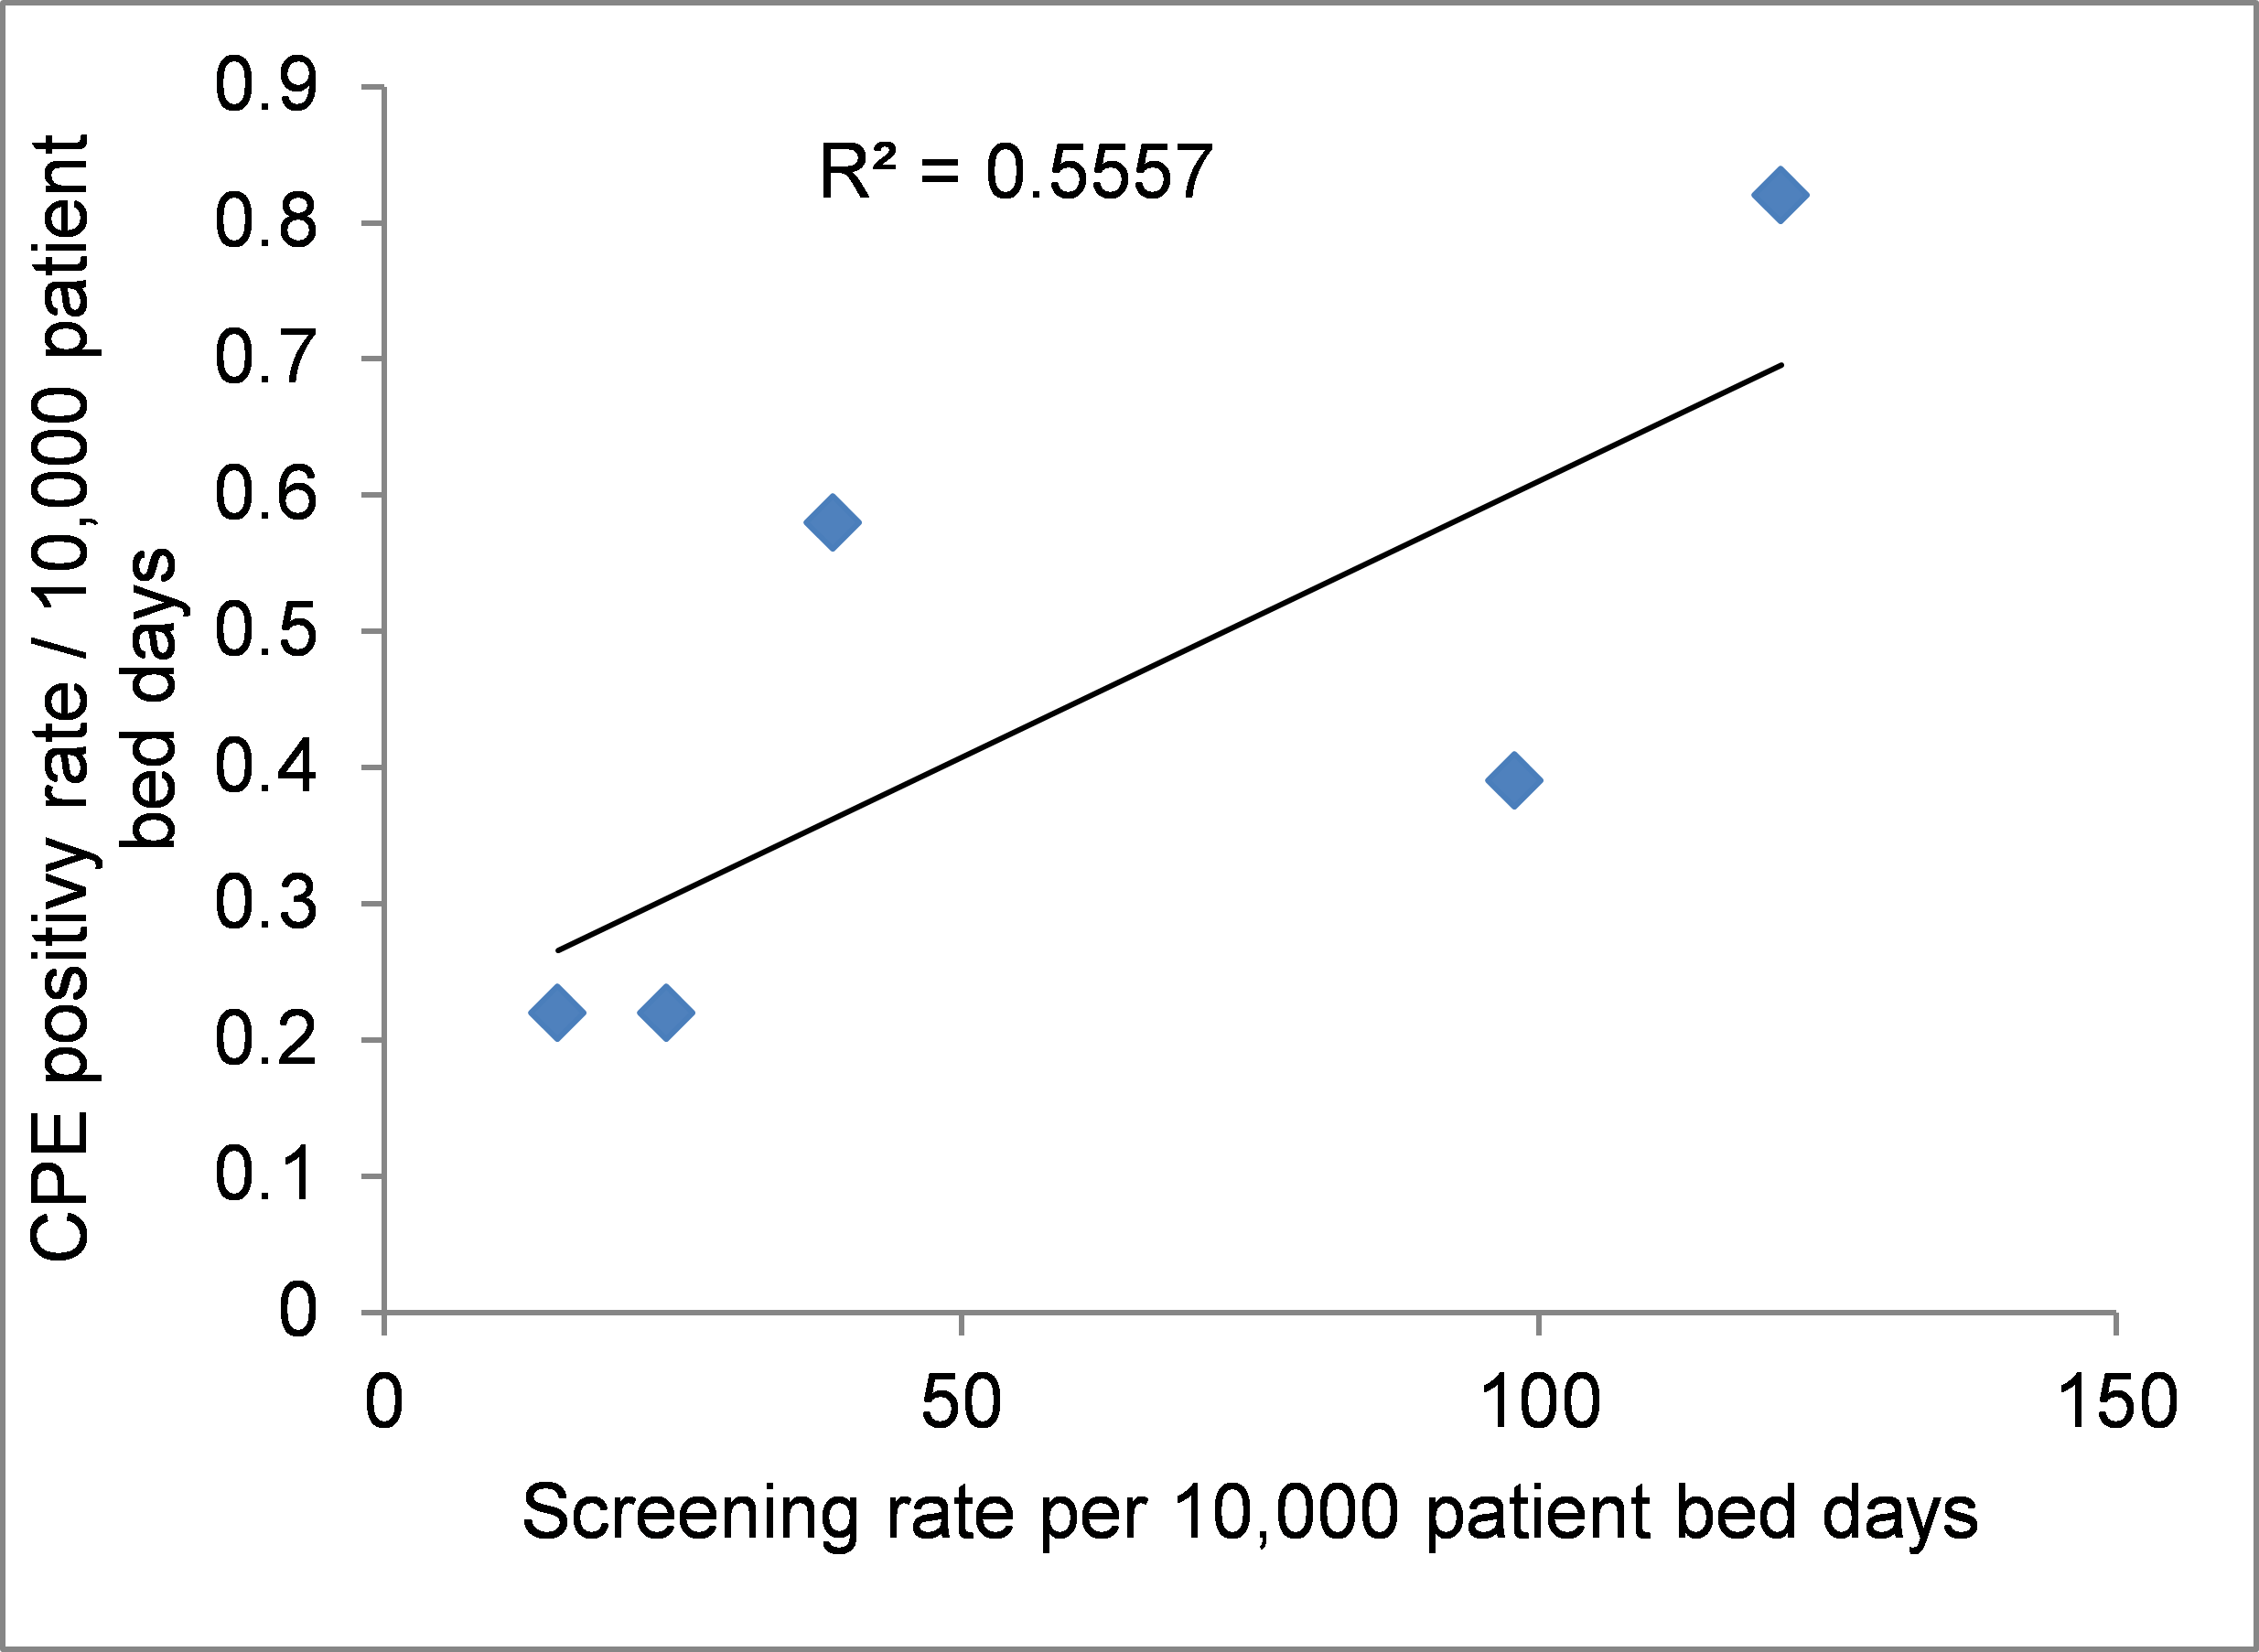
Table: CPE screening and positivity rate, by UK region.
| Screening rate, per 10,000 patient bed days | CPE positivity rate, per 10,000 patient bed days | |
| North-West | 121 | 0.8 |
| South-East (incl. London) | 98 | 0.4 |
| North-East | 39 | 0.6 |
| South-West | 24 | 0.2 |
| Midlands | 15 | 0.2 |
| National | 60 | 0.3 |
A few reflections on the study:
- Most hospitals screened patients who had been hospitalised abroad (34/36, 94%) – the two hospitals who are not screening this patient group should read this study and start doing so! 28/36 (78%) of hospitals screening patients who had been in a UK hospital with a known outbreak – and I suspect the others would screen these patients if there was a reliable way of knowing which hospitals have a current outbreak!
- The data was collected for 2016 – both our prevalence of CPE and laboratory testing methods have changed considerably since then, so that’s a bit of “that was then, this is now” about these findings.
- The study does not provide a complete national perspective – on 23% of acute NHS hospital Trusts completed the survey about CPE screening policy and prevalence.
- The study looks like two studies squashed together: the lab testing part came from one survey, and the information on CPE screening policies and prevalence came from another survey.
- In terms of testing methods, it’s a real mixed bag, although 76% of labs used an agar-based method as a first line for detecting CPE.
Part of the beauty of the NHS is our ability to take a co-ordinated approach to healthcare planning and delivery. This isn’t the case in most parts of the world. But in terms of CPE, more needs to be done to agree a common approach to the detection of CPE. It is especially important to have a regional strategy to contain the spread of CPE, because we know that CPE spread follows regional referral networks. These findings suggest that if more CPE screening were to be done, more CPE would be detected. This in turn suggests that there may be substantial pockets of ‘silent transmission’ of CPE. And the antidote to this: more CPE screening!
Image: Iconfinder.
Discover more from Reflections on Infection Prevention and Control
Subscribe to get the latest posts sent to your email.

Given that the data are cross-sectional, couldn’t it be also true that more screening is because some places have many more cases – leads to more screening, chicken-egg?
LikeLike
Hi Neil, yep that’s true. And since policies are different, with a whole range of triggers for screening, we’ll never know for sure. Perhaps a national point prevalence survey is the way to go? That would at least give us some accurate data on national prevalence and regional variation.
LikeLike
I think that’s a really good idea, I guess the screening requirements (the poo and poo sticks, no the other kind..) make that a slightly more challenging proposition
N
LikeLike
Agree not an easy stud to do. But a worthwhile one!
LikeLike
Generally I enjoy and are inspired by your blogg. However, drawing causal inference from a correlation seems a dubious academic exercise – do you really do that or did I miss something here? Cite: “This suggests that part of the reason for the variation in the apparent prevalence of CPE is that some NHS Trusts are looking harder for CPE!”
LikeLike
Hi Jorgen, of course correlation doesn’t necessarily mean causation. Point taken. Wrists slapped. Will be more careful in future!!
LikeLike
Ohh dear, that wasn’t my intention. I really enjoy your reflections and admire your effort. Working in a “low prevalence setting”, the triggers for screening and isolation, routines and compliance to these and their actual effect on our epidemiology are frustratingly complex and pitfalls compromising our causal inference seems lurking everywhere .
LikeLike
Ha! I am very grateful for the useful feedback!
LikeLike