Colleagues from the University of Edinburgh did a really nice job exploring the impact of individual public health interventions on the SARS-CoV-2 reproduction number (R) across 131 countries. Their work fueled the discussion on whether schools should be closed to control transmission. Rightfully so? Read Patricia Bruijning-Verhagens’ take on this study.
For their analyses they used the real-life interventions as they were implemented when the pandemic started and subsequently lifted this summer, inevitably with differences in timing and sequences between countries. Yet, this variation allowed them to explore how each intervention influenced the effective R-value (Reff) over time in each country. A few reflections on the study:
First, we need to understand how comparisons were made; for each country they cut the observation period into time fragments based on the non-pharmaceutical public health interventions (NPIs) that were used. A change in NPI – implemented or lifted – starts a new fragment, which can last from days to months. For each day in a fragment, they took the Reff from the available country data, and compared the Reff from the last day of a fragment to the Reff on the first day of the new fragment, and subsequently to the Reff values of all subsequent days in that fragment. The result is a daily ratio of old versus new Reff values following a change in NPI.
Next, all Reff ratios were entered in a multivariate model to determine associations between Reff ratios and implementation or lifting of individual NPI. Results can be interpreted as; what is the relative effect of implementing intervention A on Reff, while keeping measures B, C, D, etc. constant. Importantly, effects are quantified in terms of RELATIVE reduction/increase in Reff. ABSOLUTE effects of NPI will depend on the Reff at the start of intervention. For example; The Reff ratio for a ban on public gatherings is 0.76 (minus 24%) when we compare the Reff at day 28 after implementation to a situation without bans. Then, if Reff was 3 before implementation, the ban on public gatherings will reduce the Reff to 0.76*3=2.28 at day 28, yielding an absolute reduction in Reff of 0.72. Yet, if Reff was 1.2 at the start, then the absolute reduction will be 0.29 (0.76%*1.2=0.91).
The results of the multivariate model highlight another effect that needs to be considered; whith multiple NPIs implemented/lifted at the same time, their joint effect is smaller than the sum of their individual effects. This is estimated as interaction parameters Z1 and Z2. For instance, closing schools has an Reff ratio of 0.86 on day 14 following closure and the Reff ratio for banning public gatherings is 0.83. The Reff ratio for interaction on day 14 is approximately 1.17 as you can see in the figure below.
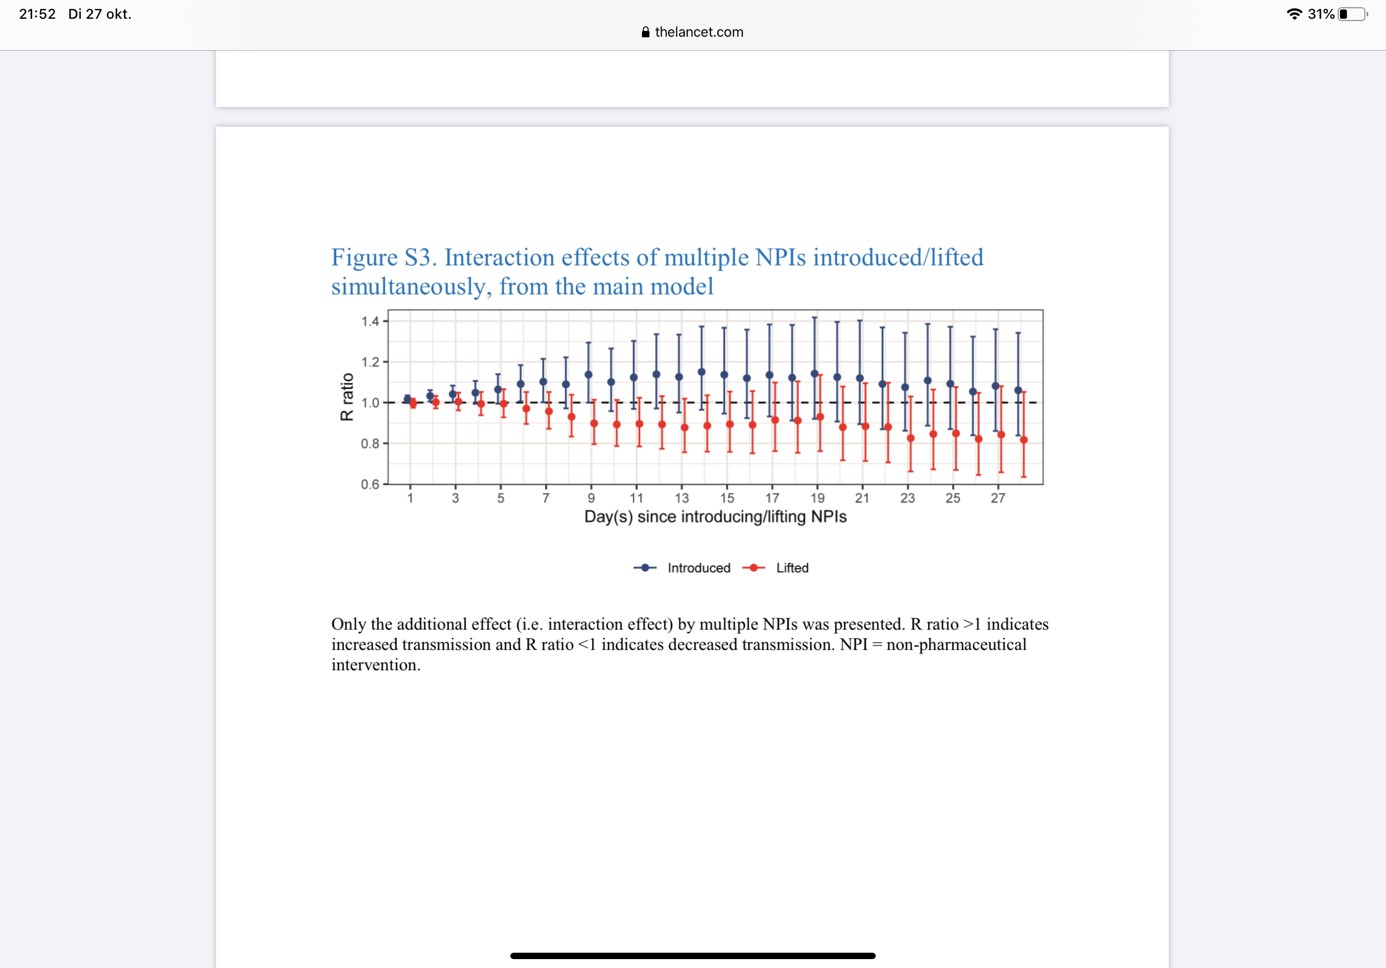
So, the interaction eliminates the effect of one of both interventions. The same happens when lifting two interventions at the same time; the joint increase in Reff is less than would be expected on the Reff ratios from each NPI separately. The effect of an NPI may thus differ, depending on the context (i.e. other NPIs in place). An alternative explanation is that the model overestimates the single intervention Reff ratios, because of collinearity in the data. Ideally, one would estimate interaction effects separately for each possible combination of two NPIs, but this requires inclusion of many more parameters in the multivariate model, which were not available. This interaction effect also becomes apparent when we look at the four scenarios of composite NPIs; Moving from scenario candidate 3 to 4, the Reff ratio for day 28 changes by 0.10 only, although two more interventions were added (school closure and stay at home requirements).

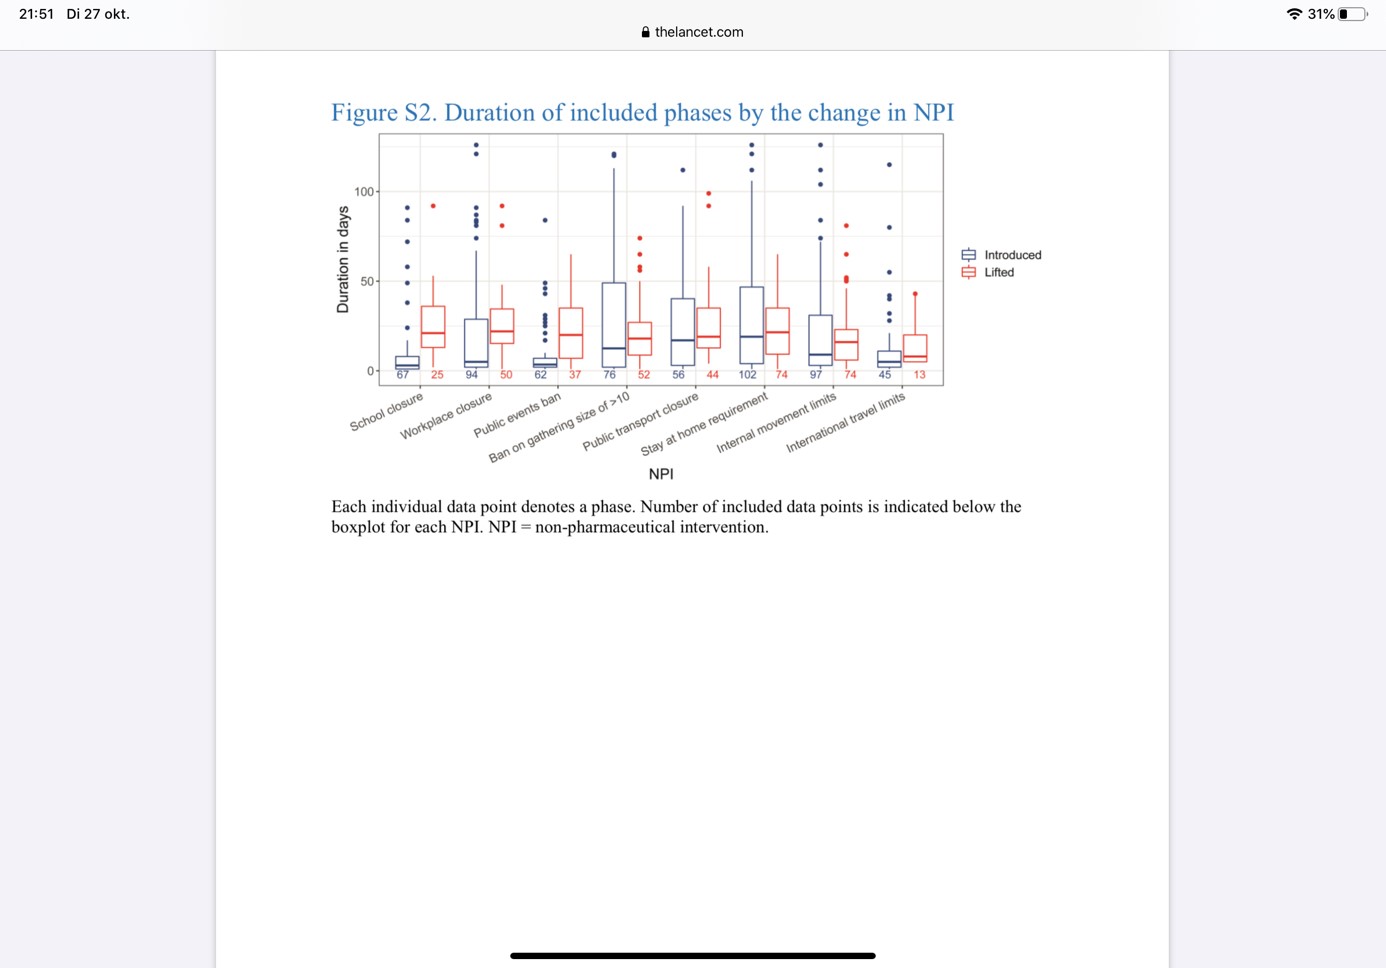
An important limitation of the data is that many interventions were implemented or released shortly after one another, seriously limiting the number of informative datapoints and precluding quantification of individual effects of interventions. This is reflected by the wide confidence intervals for many estimates. For instance, schools were already closed at the start of the observation period in 64 of 131 countries and only 25 countries lifted school closure at some point. Moreover, school closure was followed by other interventions within a week in 75% of countries, leaving only 16 countries with more than 7 days to quantify effects of school closure as separate intervention. Furthermore, differences across countries add to heterogeneity in the data and, thus, to imprecision in estimates.
To conclude, this study provides some insight in the effectiveness of some NPIs, but precise effects of individual interventions remains uncertain and will highly depend on the prevailing Reff at the time of implementation/lifting, and other interventions implemented, lifted or maintained. The authors acknowledge some of these limitations and caution that ‘ the impact on R by future reintroduction and re-relaxation of interventions might be substantially different’. Obviously, many readers that claimed major effects of NPI, in particular of school closure, didn’t make it till this stage of the manuscript.

Patricia Bruijning-Verhagen, MD, PhD, is pediatrican and epidemiologist at the Julius Center for Health Sciences and Primary Care, at the UMC Utrecht
Discover more from Reflections on Infection Prevention and Control
Subscribe to get the latest posts sent to your email.
