
BMC Medicine has published some research from our group reporting the findings of a mathematical model comparing various approaches to screening for CPE carriage. The model compared how several operational metrics varied with different approaches to screening (‘slow and cheap’ laboratory culture vs. ‘fast and expensive’ PCR) and in various specialties with variable levels of compliance with CPE admission screening and at various levels of admission prevalence of CPE. The main conclusion was that culture proved to be the best approach in most scenarios, balancing risk and resource.
Before we get to the detail, let me explain the Bertha reference. If you happened to be a child growing up in the 80s in England (like me!), you may well have come across Bertha: a stop-motion animation. Bertha was a magical machine that converted some raw materials into something quite different, and usually quite impressive. Mathematical models are like Berth to me: the mechanisms of the model are conceptually and computationally beyond me, but I can just about get my head around what goes in (“parameterisation”) and the outputs.
In the case of this modelling study, the ‘raw materials’ that we put into Berta were:
- the screening method used (i.e. slow and cheap laboratory culture vs. fast and expensive PCR);
- the speciality (ICU, vascular, renal, and haematology);
- the prevalence of CPE on admission to the speciality (which was informed by real hospital data); and
- and the coverage of compliance with CPE screening (again, which was informed by real hospital data).
And the ‘products’ that we looked for once Bertha had done her work were:
- the number of ‘at-risk’ days (when a patient with CP-CRE was not in isolation), the primary outcome;
- the total number of isolation bed days consumed;
- the total number of isolation bed days consumed by patients without CP-CRE (i.e. inappropriate isolation days); and
- the cost per risk day averted.
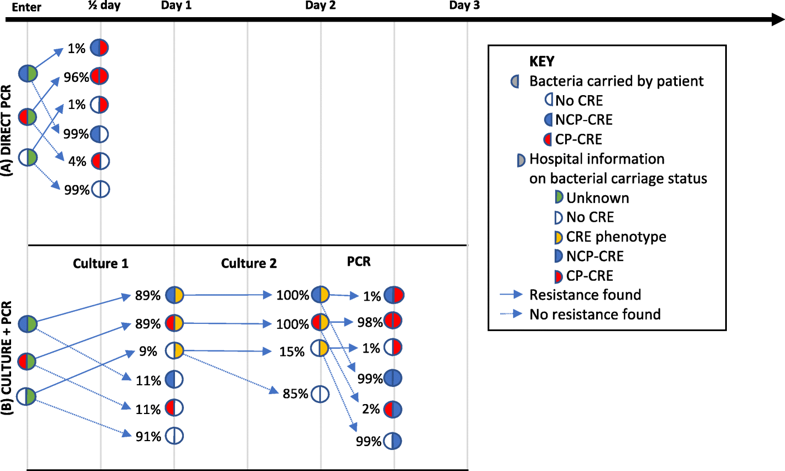
We had to think carefully about the various timepoints in the study – specifically what information the hospital knew about an individual’s CPE carriage status (see Figure 1, below). This process led us to use some non-standard terminology for CPE: CP-CRE or NCP-CRE. I’ve posted before about this – the more I think about it, the more sure I am that is the best terminology to capture all of the CPE-related carriage states.
Figure 1: Mapping what is known to the hospital, and when, along the CPE screening pathway.
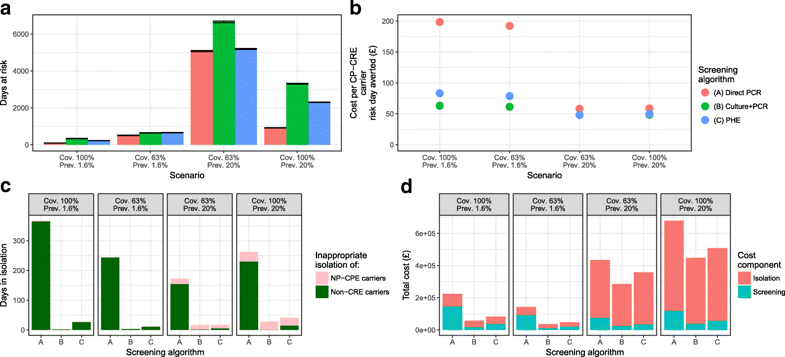
So, to the results. Using the ICU as an exemplar, the primary outcome (the number of at-risk bed days) was always lowest for the direct PCR approaches. Improving the coverage of screening was the best way to get the number of at-risk bed days down. However, the other outcomes (total and inappropriate consumption of isolation bed days and the cost per risk day averted) was better for culture (with PCR carbapenemase confirmation) in most scenarios (see Figure 2). These findings were broadly similar across the various specialities and scenarios tested.
Figure 2: (a) number of days at risk, (b) cost per CP-CRE carrier risk day averted, (c) inappropriate isolation days, and (d) total costs.
The major limitation of the model was that it didn’t include any estimate of the possible impact of more rapid detection of CPE on transmission. Whilst the mathematics were there in the model to accommodate this, we didn’t feel that we had reliable enough epi data to parameterise the model to provide meaningful outputs around CPE transmission. Instead, we felt that the number of ‘at-risk’ days, when a CPE carrier was not in isolation, was a more reliable and tangible proxy measure of transmission risk.
Of course, all model are wrong, but we think that this one is useful, providing insight into the operational impact of various approaches to CPE screening. Based on these findings, we concluded that culture (with PCR for carbapenemase confirmation) provides the optimal balance of cost and risk days averted, at varying isolation, prevalence and screening coverage scenarios.
Discover more from Reflections on Infection Prevention and Control
Subscribe to get the latest posts sent to your email.
